Author: Ta-Te Lin, Professor, National Taiwan University, Department of Biomechatronics Engineering
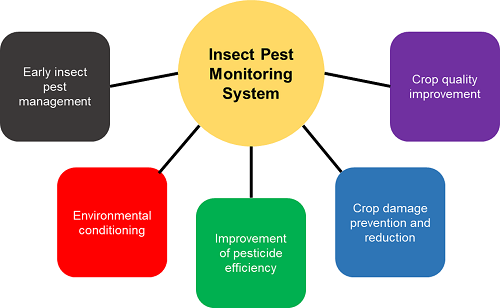 Figure 1. Primary goals of the automated insect pest monitoring system.
The primary goals of the insect pest monitoring system are shown in Figure 1.
By monitoring the insect population in the farm, there are several improvements that can be performed. First, the system can be used for early insect pest management. This means that farmers can be notified earlier before possible insect pest outbreaks may occur. Next, the environment can be controlled and conditioned based on the ideal conditions of the insects and plants. Once they know the most active environment condition levels of the insects, they can prevent them from reproducing or emerging. In this way, pesticides can also be scheduled properly. Farmers can avoid spraying pesticides whenever it is not necessary since they can see if the insect population levels are not yet alarming. Together with these solutions, crop damage can be prevented and the qualities of their crops can improve.
From almost more than two years of testing the system, we started to improve our system slowly to make it more robust and reliable. The latest version of our insect pest monitoring device is shown in Figure 2.
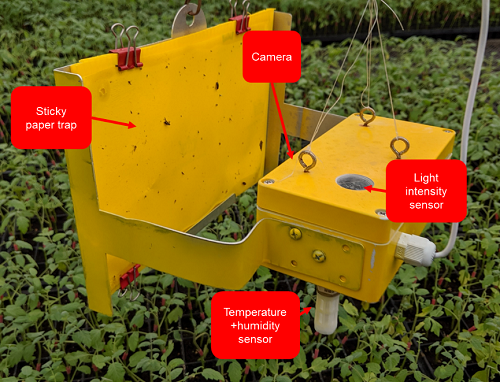 Figure 2. Actual set-up of the insect pest monitoring device in a greenhouse.
As shown in Figure 2, the device was now improved by using more robust materials that can withstand the environmental condition inside the greenhouses. Similar to its predecessors, it includes a temperature-humidity sensor, light intensity sensor, and a camera facing the sticky paper trap. In each farm, farmers can put as many devices as required depending on the size of their farm. Typically, the devices are placed on suspected insect hotspots to prevent further crop damage. The devices are connected to a Wi-Fi router and sends the environmental data and sticky paper trap images to our remote server. After processing, the data such as insect distribution, count, alarms, and environmental condition are displayed in our website and the users’ smartphones. The structure of the system is shown in Figure 3.
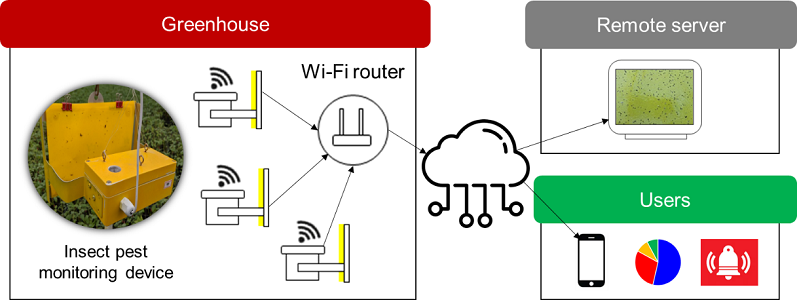 Figure 3. Automated insect pest monitoring device system structure.
The described system is now deployed in several farms in Taiwan. Since the installation, several long-term data were obtained that shows the advantages of having an insect pest monitoring system to assist in the decision-making process of the farmers. It was found from the long-term data that the percentage of insect pests found in each farm varied depending on the season, greenhouse management, and many other factors. Sample long-term data results from two farms are shown in Figure 4.
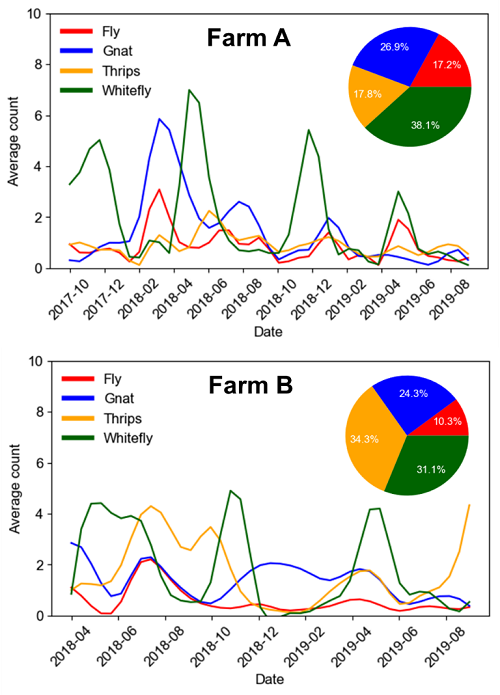 Figure 4. Long-term insect pests counting results from two of the experimental Farms A and B.
The results shown in Figure 4 are both obtained from tomato seedling greenhouses in Southern Taiwan. From the two-year data in Farm A, it can be observed that whiteflies are more dominant. It can also be seen from the results that there are periods in which the whiteflies emerge. The year 1 and year 2 results show that there are similar times when the whiteflies emerge. This was specifically found during the winter time (October to January) and in the middle of summer (May to June). Upon consultation with the farm staff of Farm A, they agree that there more whiteflies during these times and it was caused by their reduced management activity in the greenhouse. On the other hand, there were more thrips in Farm B. According to the farm staff of Farm B, the thrips were mostly found entering from the paddy fields surrounding their greenhouse. This proves that the count information obtained from both farms can be used in the future to improve the management strategies of the farmers and guide them with quantitative data.
Furthermore, the system can be used for developing more useful applications. To do so, the monitoring system includes a smartphone APP called NTU IPM that are given to the farmers, available in both Android and iOS. For the users of the monitoring system, they can navigate to the WSN Tools tab where they can see the data inside their farm. Sample screenshots of the dashboard is shown in Figure 5.
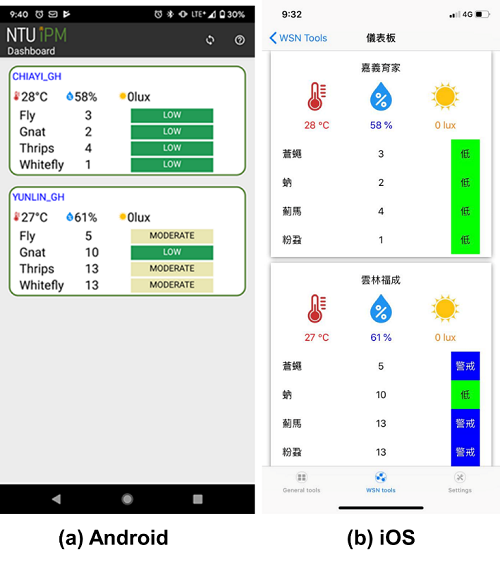 Figure 5. NTU IPM smartphone APP dashboard screenshots in Android and iOS.
The data shown in the screenshots are from Farms A and B that were mentioned previously. Through the APP, basic information regarding each farm such as the environmental condition, current day’s insect count, and insect count alarms. The key feature in this page is the alarm function. Oftentimes, the raw data shown in the APP are not simple enough to be useable for the farmers. Through the alarms, the insect counts are converted into four levels: Low, Moderate, High, and Severe. This is done by computing the percentage of increase counts accumulated throughout the time the system was able to collect data from the specific farm. For example, the alarms raised in Farm B - YUNLIN_GH show Low level for gnats. This simply means that the number of gnats found in the farm were normal and not alarming. However, it can also be seen that there were Moderate level for flies, thrips, and whiteflies. This means that the number of insect counts for the three species are not normal and higher than usual. But if any of insect counts was in the High level, it might be a time that the farmers need to spray pesticide. This is most especially when the level is Severe, which is a very extreme case.
The data analysis results and developed alarm system proved that with the help of insect pest monitoring system, the pest management in greenhouses can be operated more efficiently.