Author: Ming-Hsin Lai, Hsiu-Ying, LuPo-Hsun Chen, Kuei-Tso Lee
Introduction
Planthoppers are a kind of rice pests that cause huge damage to the crops in several Asia countries. These pests may devastate crops in a short time and even carry some disease, causing the damage of paddy both morphologically and physiologically. Planthoppers are so small that it is difficult to observe them. Moreover, they reproduce extremely fast and spread quickly to a large area. If we do not take appropriate actions in time, they may cause damage in an explosive way. Although spraying pesticides can kill most planthoppers, it will also pollute the land, and the polluted rice will be harmful for human health. Therefore, it is urgent to develop a monitoring and forewarning system that is capable of detecting planthoppers in the paddy fields in time. With this system, farmers only need to spray pesticides when the number of planthoppers exceeds a pre-selected threshold. The reduced usage of pesticides would be helpful to human health.
Recently, many methods have been proposed to recognize rice planthoppers in paddy fields. Zou and Ding proposed a recognition algorithm to achieve real-time identification, consisting of single-threshold segmentation and wavelet-based pest edge extraction. YAO Qing et al. proposed a three-layer model to detect whiteback planthoppers. This model consists of Harr feature based AdaBoost classifier, HOG feature based SVM classifier, and threshold-based judgment. This method achieves an 85.2% detection rate and a 9.6% false detection rate. Sarin Watcharabutsarakham et al. proposed a method to monitor brown planthoppers which combines an image classifier with a mobile application. The classifier is modeled as a support vector machine based on color and local texture features. This method achieves an 83% accuracy rate. Tsai et al. proposed a simple model with the following steps: (1) find the region of interest, (2) do color analysis, and (3) recognize rice planthoppers with the decision-tree algorithm.
However, those aforementioned methods have difficulty handling particular conditions, such as occlusion, lighting variations, and deformation. To deal with these problems, we will use a deep convolutional neural network (DCNN), which can extract high level features from the image to detect planthoppers. Recently, there are two main streams using CNN models for object detection. The first approach uses Region Proposal Network (RPN) proposed in Faster R-CNN to find ROIs (Region Of Interest) and feed in region proposals one by one to the classification network. The second approach discards ROI generation and makes prediction on class and location at the same time, such as SSD and YOLO.The second approach is typically faster than the first approach since there is no need to wait for the preparation of ROIs.
Comparing Faster R-CNN, SSD and YOLO with the same base network, the last two are ten times faster than Faster R-CNN. Besides, in terms of accuracy, SSD is better than the other two in Pascal VOC competition. Hence, we select SSD as our detection model and revise it properly to meet our requirements. For the base network, we use VGG-16.
Data
This project is cooperated with Industrial Technology Research Institute (ITRI) and Taiwan Agricultural Research Institute. ITRI is responsible for setting up cameras in the paddy fields and collecting image data. Our dataset has 1152 training images and 50 testing images. Figure 1 shows an example of the image data.
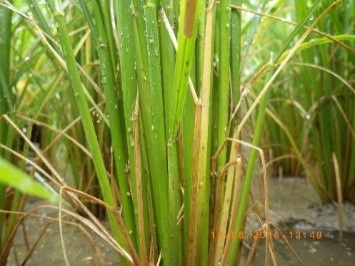 Figure 1 Example of image data. There are three different resolutions of images in the dataset: 3456x4608, 3672x4896, and 2592x4608 pixels (height x width).
Model
The SSD network adds six extra layers to the end of the VGG-16 network. These layers decrease in size and the layers with smaller sizes are responsible for detecting larger objects in the original image. There are anchor boxes of different shapes and sizes in order to detect objects of different shapes. Choosing appropriate aspect ratios of anchor boxes may improve the accuracy of the model. The original SSD model can classify 21 classes. However, our dataset only includes two different classes (planthopper/non-planthopper). It is not necessary to use such a complicated model for binary classification. Hence, we reduce the number of filters to 1/4 of the original ones. Moreover, since planthoppers are typically small in the image, we remove the last two layers which are designed to detect larger areas in the image.
Training
The image data should be cropped into small patches (300 x 300 pixels) to match the input size of the SSD network. In the training process. First, the image data are cropped into the size of 350 x 350 or 512 x 512 pixels. These patches are cropped in an overlapping way with a small margin. Hence, planthoppers that locate on a border line of one patch may appear in another patch. In our setting, a planthopper in an image patch will be treated as a positive sample if more than 70% of its body appears in the patch. This setting will be helpful for detecting planthoppers that are partially occluded by leaves or stems. Finally, the patches with no planthoppers are discarded because they largely increase the number of negative samples.
Testing
After testing, it is considered a true positive if the prediction and the ground truth have their IOU value bigger than 0.5. It is a false alarm if the prediction is wrong. It is a miss if a planthopper is not detected. The number of mistakes equal to the number of false alarms plus the number of miss. Here we use precision and recall to evaluate the performance of our algorithm. Precision is the number of true positives over the number of predictions. Recall is the number of true positives over the number of planthoppers in the image. Our system can achieve the precision value of 89.38% and the recall value of 91.93%. Figure 2 shows the test result of an image.
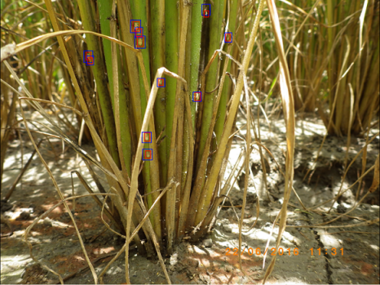 Figure 2 The test result of Model 6. Red boxes are the prediction results, and blue boxes denote the ground truth. A total of 10 planthoppers are detected. There are only 1 miss and 1 false alarm.